- A record August and the second-warmest year to date
- A record-setting El Niño event
- Record heat across much of the world
- Good odds of being world’s warmest year
- Datasets are split on whether 2026 is headed for a record
- 2027 very likely to be the warmest year on record
- Earth’s energy imbalance has more than doubled
- Arctic sea ice minimum tied for 10th lowest, Antarctic near record lows
With three-quarters of the year now past, it is virtually certain that 2026 will be the warmest or second-warmest year on record.
A rapidly strengthening El Niño, alongside human-caused global warming, made this year’s August the warmest on record and September the second-warmest.
El Niño is the warm phase of a recurring climate pattern in the tropical Pacific that releases heat from the ocean into the atmosphere and temporarily boosts global temperatures.
Carbon Brief’s analysis gives 2026 a 67% chance of surpassing 2024 as the warmest year on record across an average of six global temperature datasets.
In January, it is likely the groups that report global surface temperatures will be divided on whether 2026 officially beat 2024’s record.
Currently, the odds for a record year range from as high as 97% in Berkeley Earth’s dataset to less than 20% in European Copernicus/ECMWF’s ERA5 reanalysis product.
With El Niño expected to intensify into the winter, Carbon Brief projects that 2027 will be 1.7C above pre-industrial levels, with a 96% chance that it is the warmest year on record.
In this latest “state of the climate” quarterly update, Carbon Brief finds:
- August 2026 was the warmest August on record in all six major datasets, at around 0.12C above the previous record. September was the second-warmest September, behind 2023.
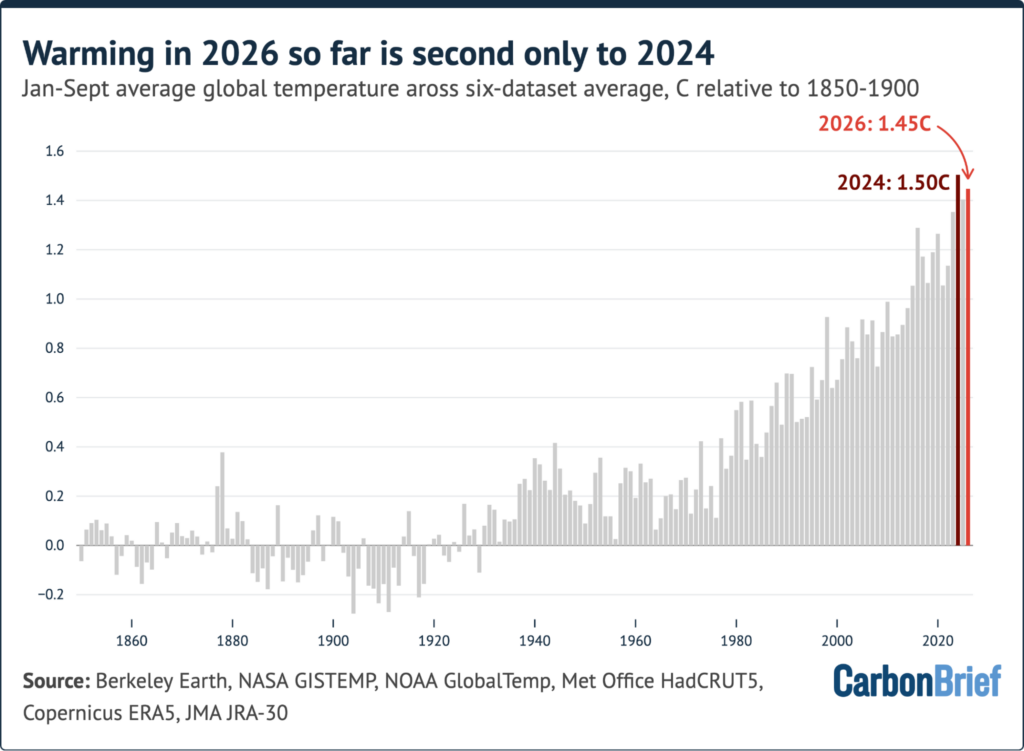
- January-September was the second-warmest such period on record, at around 1.45C above pre-industrial levels, behind only 2024.
- El Niño broke the daily “Niño3.4” region record in September and has stayed above the previous record every day since. Nearly all forecast model runs have it as the strongest El Niño on record, with a peak of around 4C occurring this winter.
- Around 22% of the world’s surface saw its warmest July-September on record, including much of the tropical Pacific, the western Mediterranean and Iberia. Western Europe had its hottest summer on record and Spain its warmest September, beating the previous record by 0.7C.
- Carbon Brief projects that 2026 will end up around 1.52C above pre-industrial levels, with a 67% chance of beating 2024’s record.
- Whether 2026 is declared the warmest year depends on the dataset; a record is likely in Berkeley Earth and NASA GISTEMP, is too close to call in HadCRUT5, JRA-3Q and NOAA and is unlikely in ERA5.
- Earth’s energy imbalance has more than doubled since the start of the satellite record, from around 0.5 watts per metre squared (W/m2) in the 2000s to around 1.25W/m2 over the past decade.
- The Arctic sea ice minimum was tied for 10th lowest in the satellite record, while Antarctic sea ice saw its third-lowest winter peak.
- This year’s record-setting El Niño will have its largest effect on global temperatures in 2027. Carbon Brief projects 2027 at around 1.7C above pre-industrial levels, with a 96% chance that it will be the warmest year on record.

A record August and the second-warmest year to date
Carbon Brief analyses records from six different groups that report global surface temperatures:
- NASA’s GISTEMP
- NOAAGlobalTemp
- The Met Office Hadley Centre and University of East Anglia’s HadCRUT5
- Berkeley Earth
- Copernicus/ECMWF’s ERA5 reanalysis product
- The Japan Meteorological Agency’s JRA-3Q reanalysis product
There are a number of additional groups that feature in Carbon Brief’s annual “state of the climate” update, but are not included here due to a lack of regular monthly updates.
The first nine months of 2026 were the second warmest on record in all six datasets, behind only 2024.
The figure below shows annual temperatures in each dataset since 1970, along with the 2026 average to date.
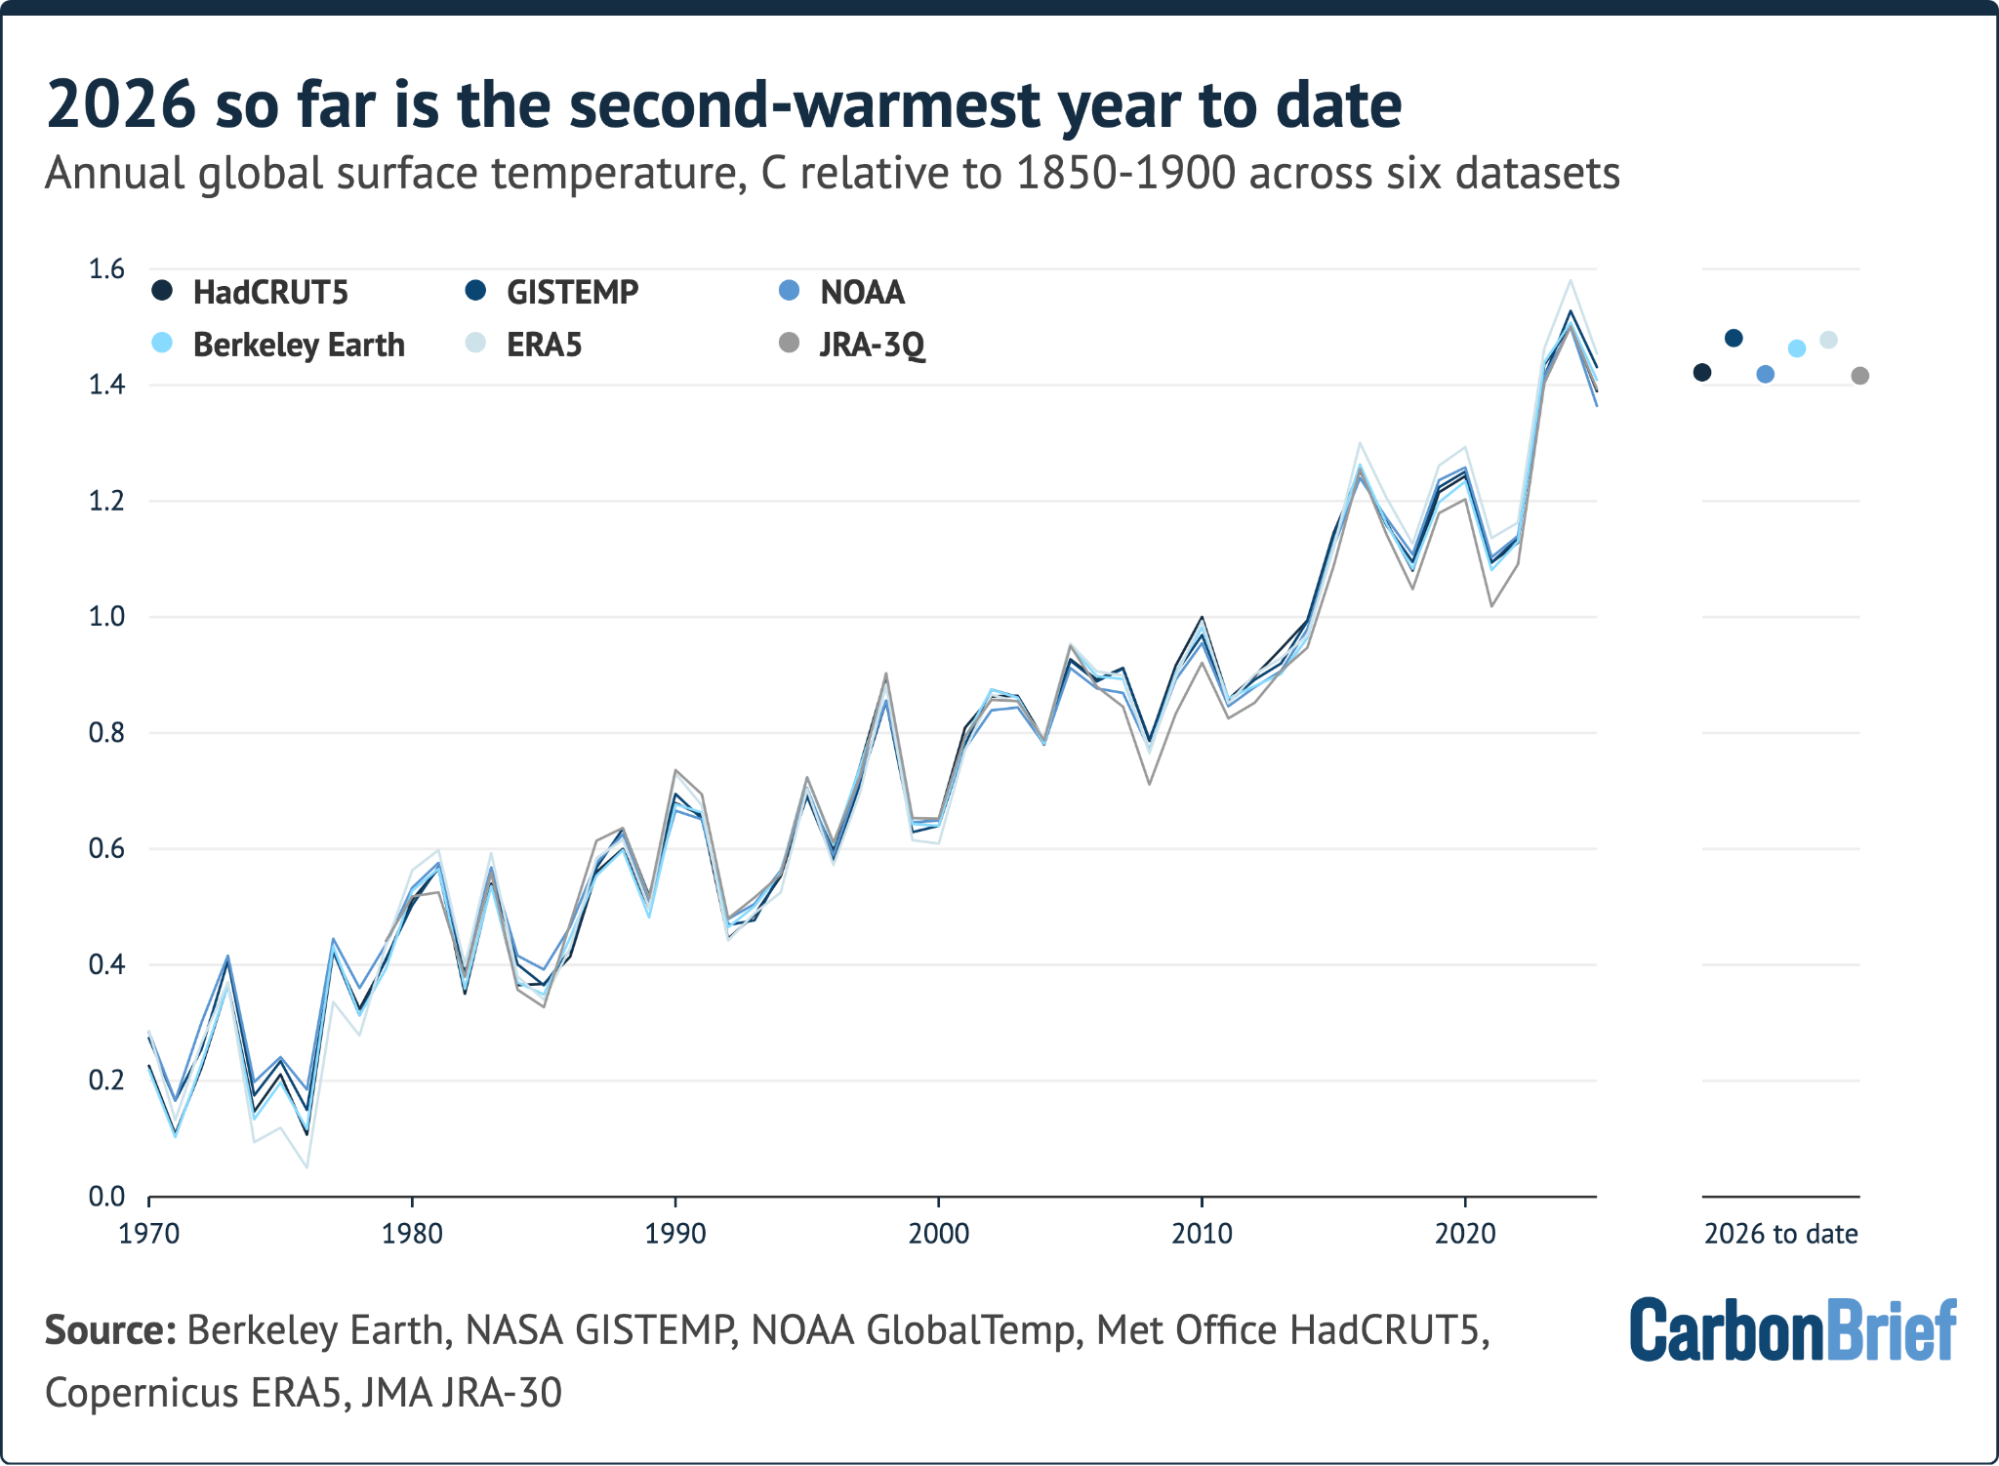 Global mean surface temperatures datasets aligned on a common 1981-2010 baseline, then shifted by the average 1850-1900 to 1981-2010 warming (0.67C) in HadCRUT5, NOAA and Berkeley Earth. 2026 to-date dots are staggered horizontally to avoid overlaps and the HadCRUT5 is for January-August as September data was not available at time of publication.
The year got off to a comparatively slow start. Each month from January to June ran cooler than the same month in 2024, as the lingering effects of weak La Niña conditions gave way to a developing El Niño.
La Niña and El Nino are the cool and warm phases of the El Niño-Southern Oscillation (ENSO), a recurring climate pattern in the tropical Pacific that reshapes weather patterns around the world.
That changed in the third quarter of the year. July 2026 was the second-warmest July in the six-dataset average and a narrow record in the NASA GISTEMP and NOAA datasets. (NOAA’s own assessment described it as tied with July 2024.)
August then set a new record for the month by around 0.12C in the six-dataset average. It was the warmest August on record in every one of the six datasets, by margins ranging from 0.07C (HadCRUT5 and NOAA) to 0.13C (ERA5).
September temperatures stalled a little following the rise in July and August. At around 1.62C, it was the second-warmest September on record in all five datasets to have reported so far, around 0.08C below the record set in September 2023.
The figure below shows each month of 2026 alongside every year since 1940, with 2023, 2024 and 2025 highlighted.
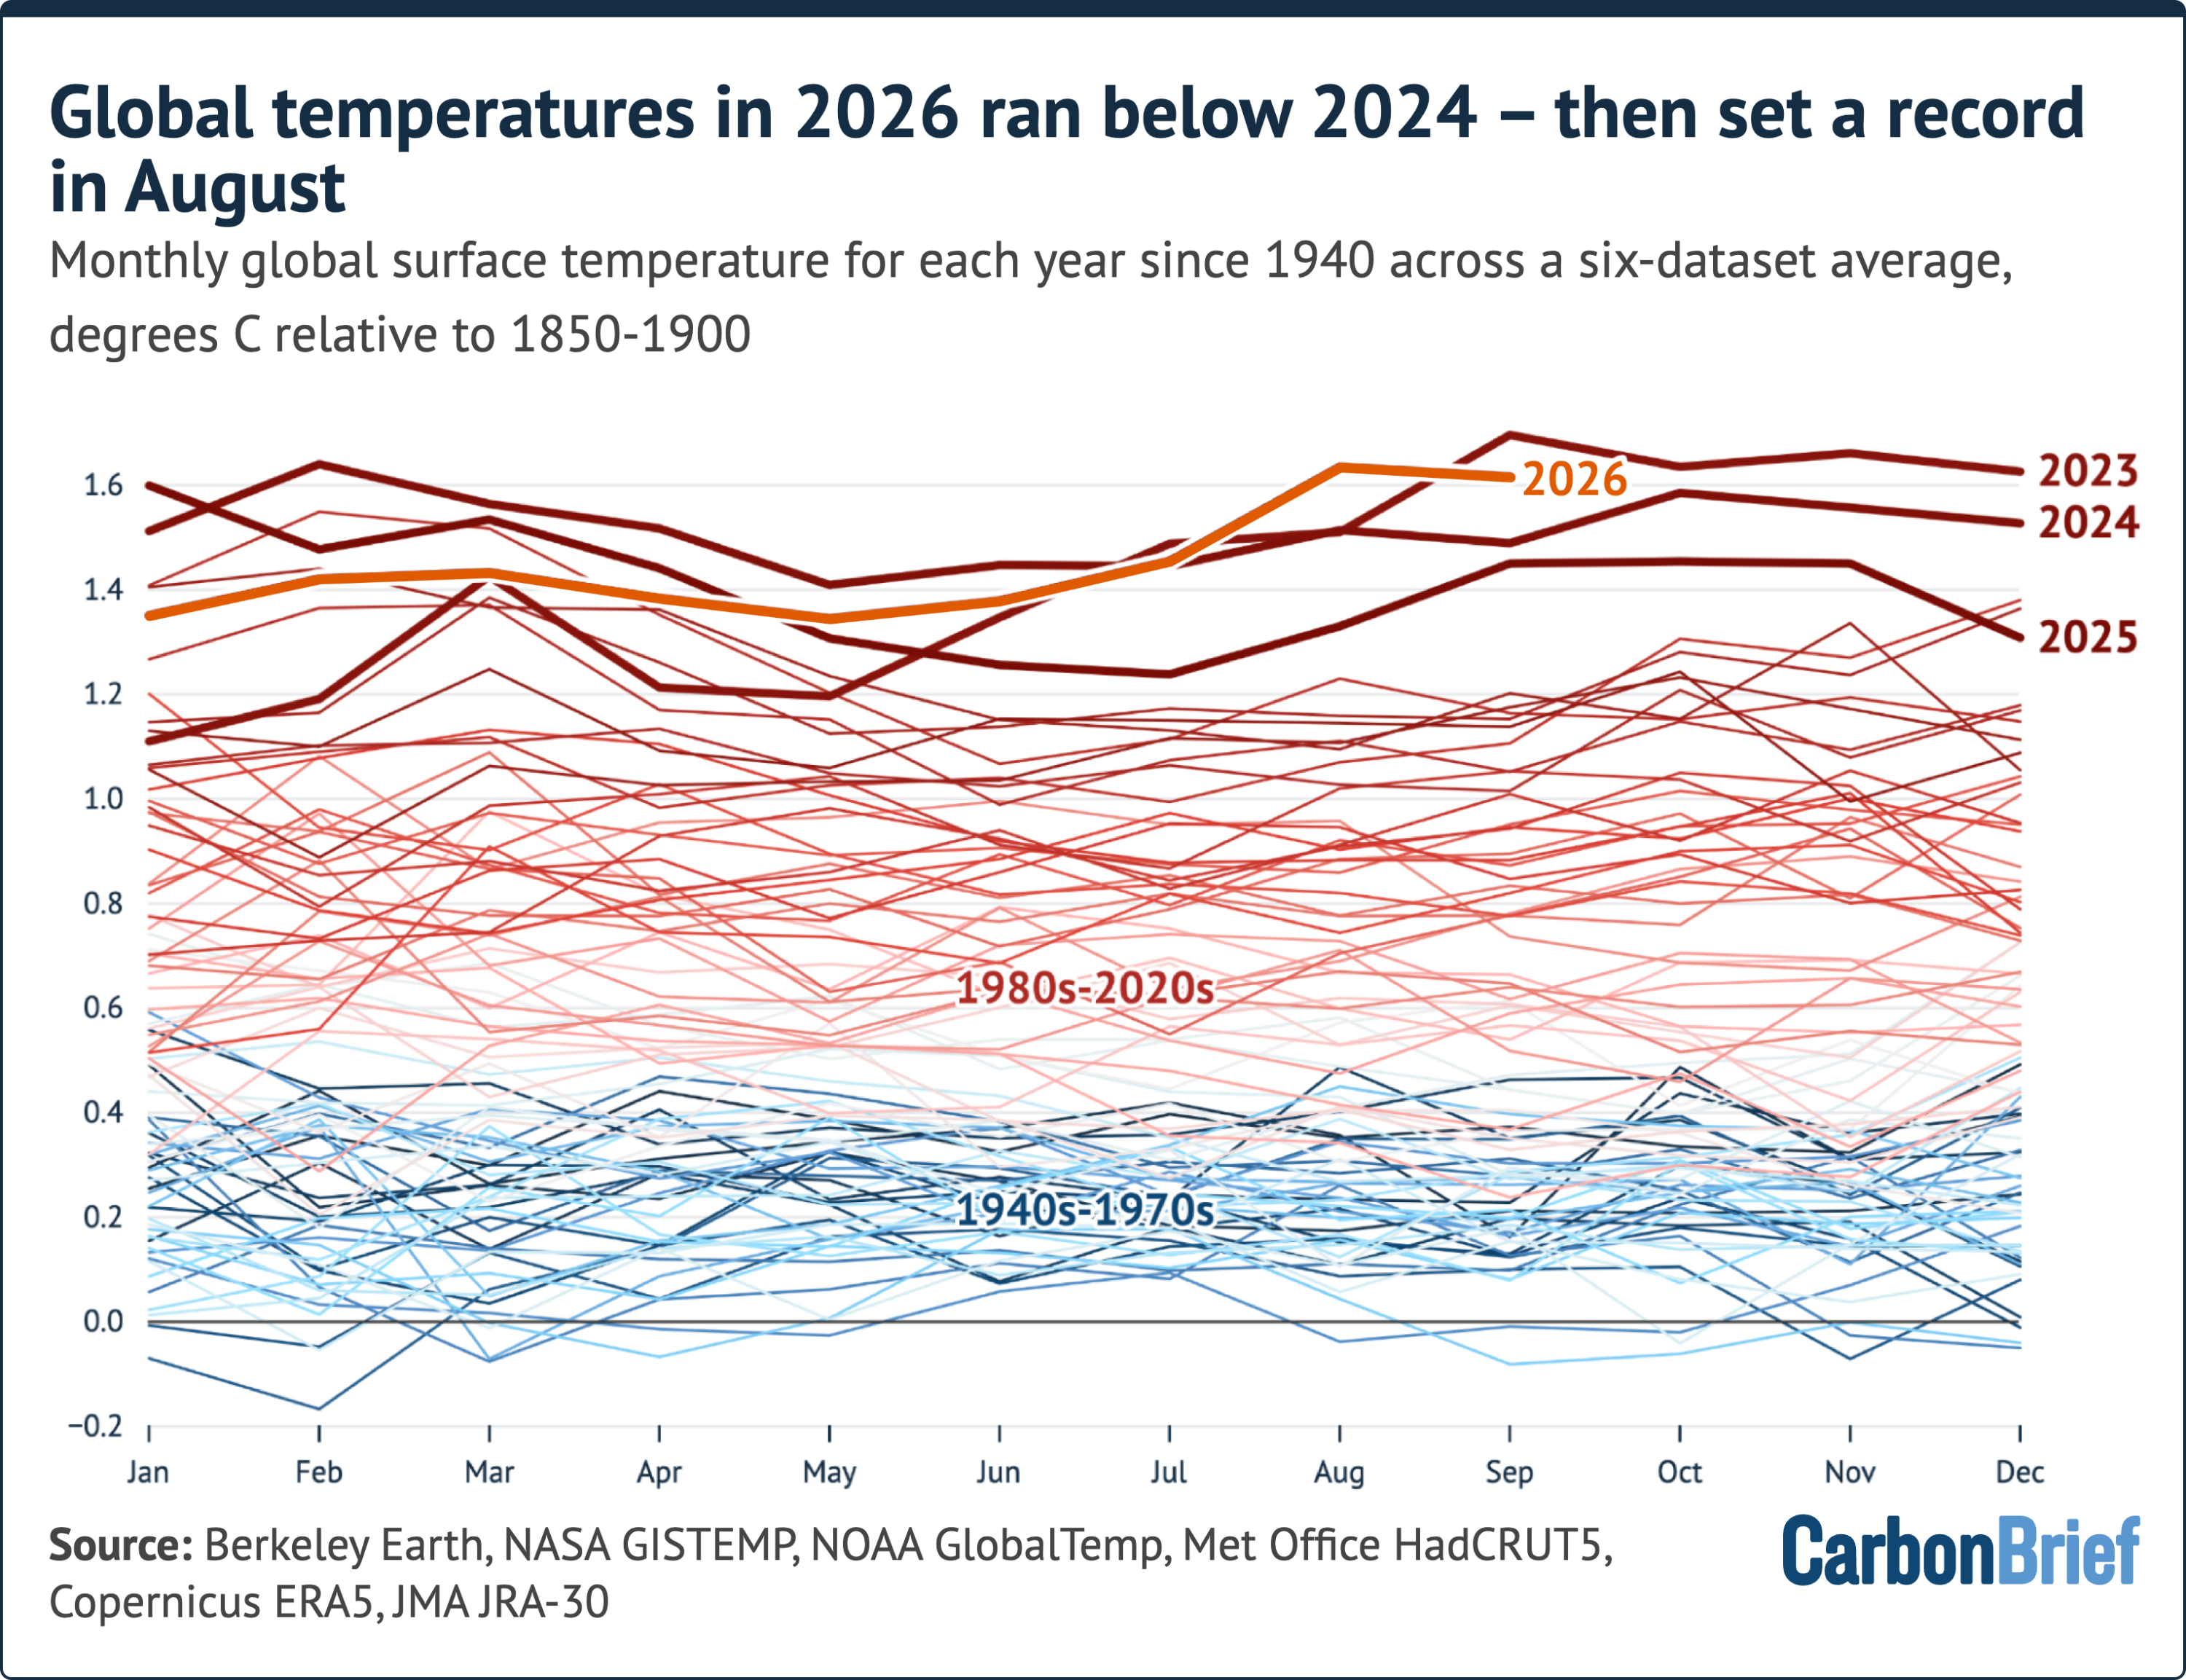 Monthly averages of six global mean surface temperature datasets. The September datapoint excludes HadCRUT5 which had not reported at the time of publication.
Across the six-dataset average, July-September 2026 was effectively tied with the same period in 2023 as the warmest on record, at around 1.57C. It ranked first in GISTEMP and NOAA (and in HadCRUT5 for July-August), and second in Berkeley Earth, ERA5 and JRA-3Q.
The figure below shows the January-September average for every year since 1850. It shows how temperatures in 2026 to date sit at 1.45C – around 0.06C below 2024.
A record-setting El Niño event
In September, El Niño crossed a milestone. The daily sea surface temperature anomaly in the “Niño3.4” region of the tropical Pacific – the area most widely used to gauge El Niño strength – broke the record, previously set in November 2015, to become the strongest event since the satellite era began in 1981.
This year’s El Niño has remained above that record every day since. September recorded the highest monthly Niño3.4 region temperature anomaly since records began in the mid-1800s.
As of 18 October, the daily value stood at around 3.5C above the 1996-2025 average for the time of year and around 0.4C above the 2015 peak.
The figure below shows how El Nino is projected to keep intensifying until the end of this year.
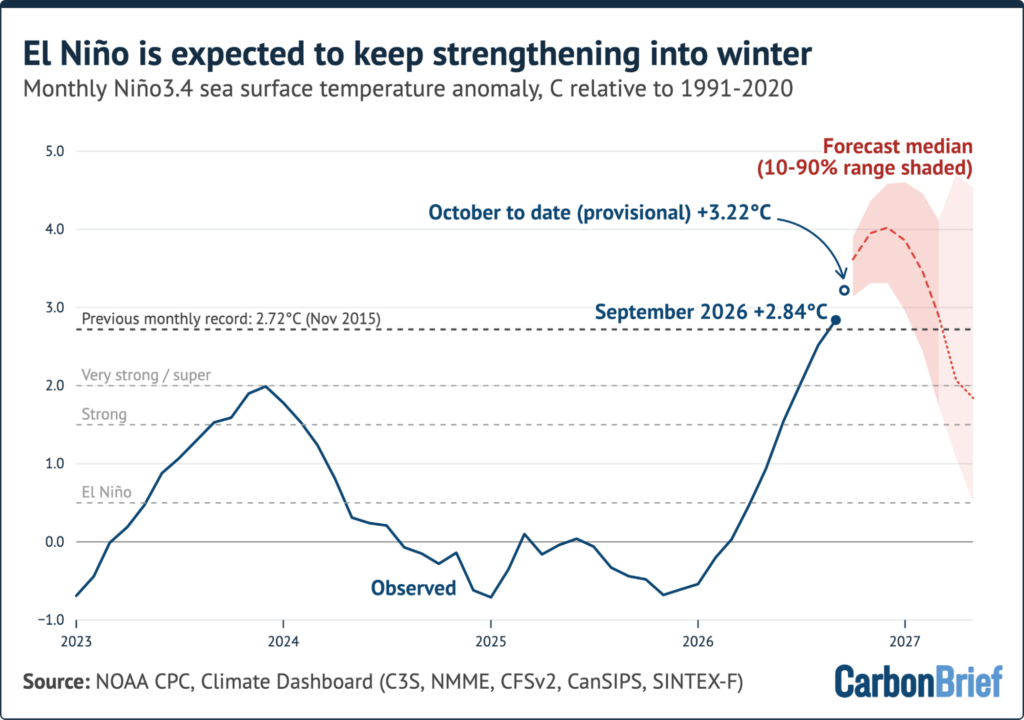 Average of 656 forecasts across 14 dynamical models. The lighter shaded area reflects the period when only seven models are available.
Carbon Brief examined 656 forecasts from 14 different climate models that were run between late September and mid-October. On average they estimate that this year’s El Niño will peak around 4C in December – more than 1C above the prior record.
(Ten models expect a December peak and four anticipate a November peak.)
Based on an analysis of tree rings and coral sediments, it is possible that this will be the strongest El Niño event in a millennium.
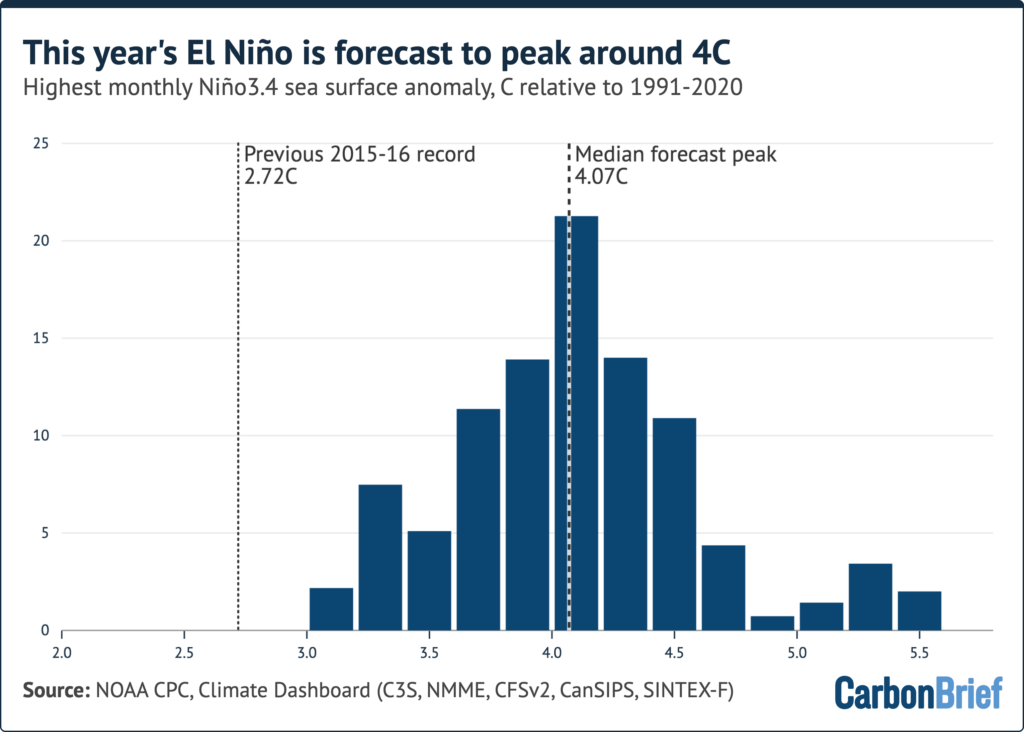 Niño3.4 region sea surface temperature peak warming projected from 656 runs of 14 different dynamical El Niño models. Y-axis denotes the share of model runs in each 0.2C “bin”.
The forecasts have strengthened since Carbon Brief’s July “state of the climate” update, when El Niño was expected to peak around 3.6C.
While human emissions of CO2 and other greenhouse gases are responsible for effectively all of the Earth’s long-term warming, temperatures in any given year are strongly influenced by short-term variations to the Earth’s climate associated with El Niño and La Niña events.
Global temperatures tend to lag the tropical Pacific by around three months, which means an El Niño peaking around the end of 2026 will have its largest effect on global temperatures in 2027.
Record heat across much of the world
In addition to high global average surface temperatures, the past three months have seen records broken across many parts of the planet.
The map below shows July-September 2026 temperatures relative to the 1981-2010 average in the ERA5 reanalysis.
Globally, temperatures were 0.96C above that 30-year period and 1.58C above the ERA5 1850-1900 pre-industrial average.
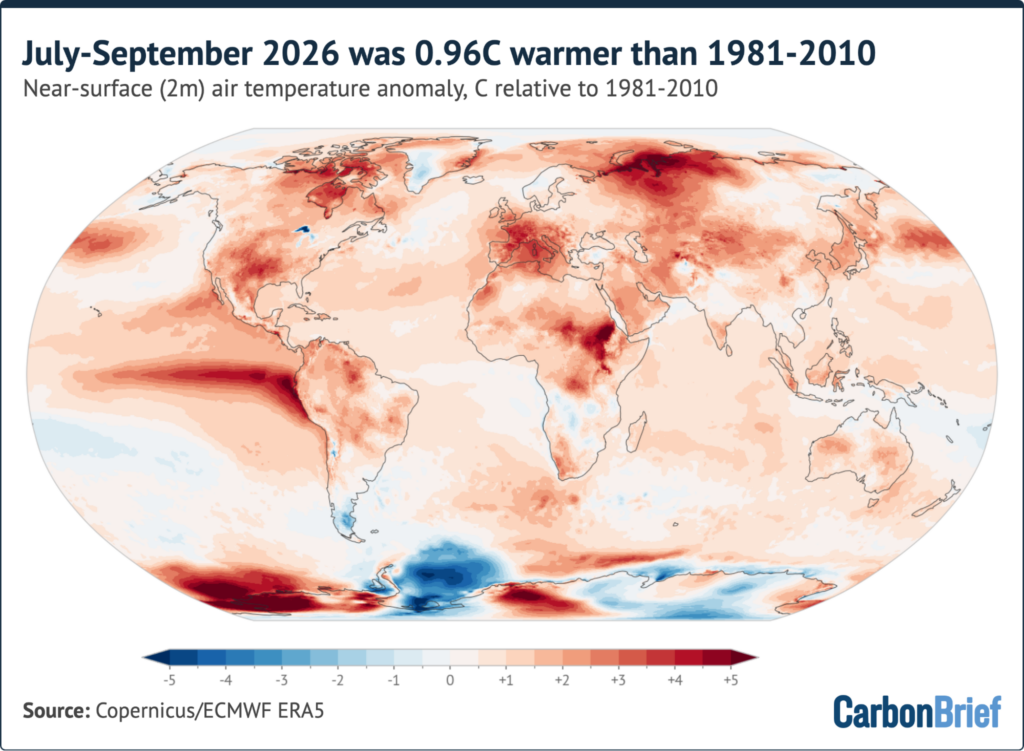
The El Niño is clearly visible as a band of exceptional warmth stretching across the eastern and central tropical Pacific, with temperatures more than 4C above average off the coast of Ecuador and Peru.
Western Europe and the Mediterranean were also unusually warm, with temperatures around 3C above average over France and the western Mediterranean Sea. North-west Russia, the Canadian Arctic, south-central North America, eastern Africa and parts of west Antarctica were also exceptionally warm.
The most notable part of the planet that was colder than usual was the Weddell Sea sector of Antarctica, which came in at more than 2C below average for the season.
The map below shows how July-September 2026 ranked against every year in the ERA5 record (1940-2026) at each location. Areas in dark red saw their warmest July-September on record; blues show areas among the five coldest.
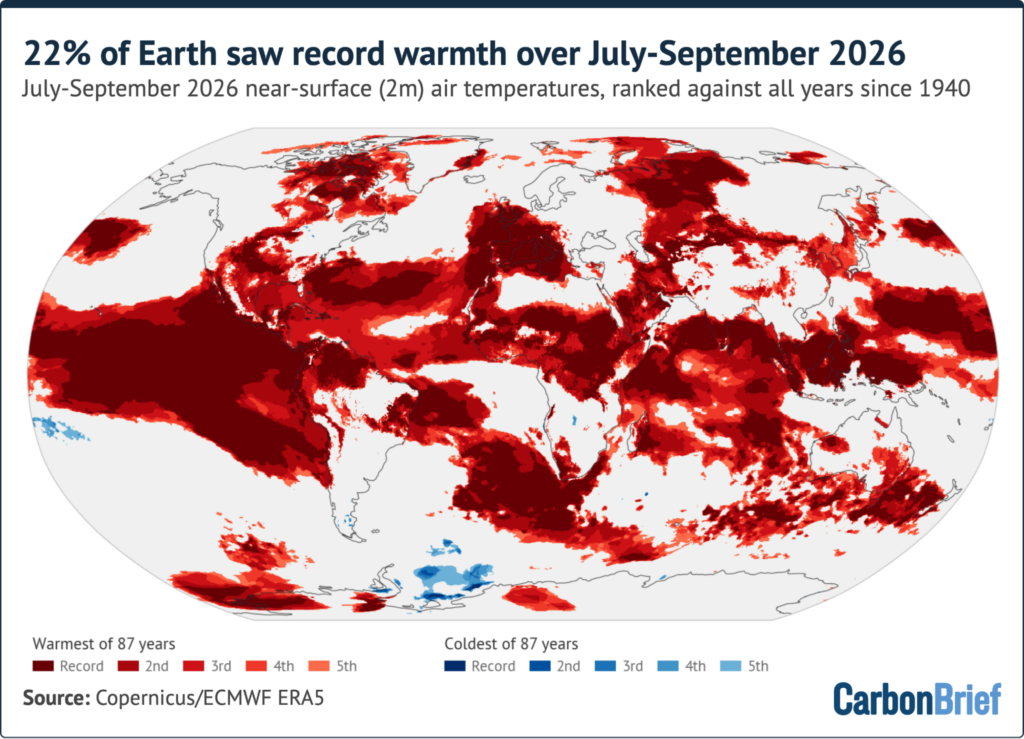 Areas where hot and cold records were set from July-September 2026 compared to the same period in all other years since the ERA5 dataset began in 1940. Share of global surface: 21.5% record warm, 49.9% top-five warm, 0.5% top-five cold and <0.1% record cold.
Around 22% of the world’s surface saw its warmest July-September on record and around half experienced one of its five warmest. By contrast, around 0.5% of the world saw one of its five coldest July-September periods.
Record warmth covered most of the El Niño region (including more than 90% of the Niño3 and Niño3.4 regions) along with sizeable parts of the south Atlantic (39%), the tropical Indian Ocean (34%) and the subtropical North Atlantic (25%, with 85% in its five warmest).
On land, around 85% of France and Iberia saw a record-warm July-September.
In September alone, around 20% of the world’s surface saw its warmest September on record.
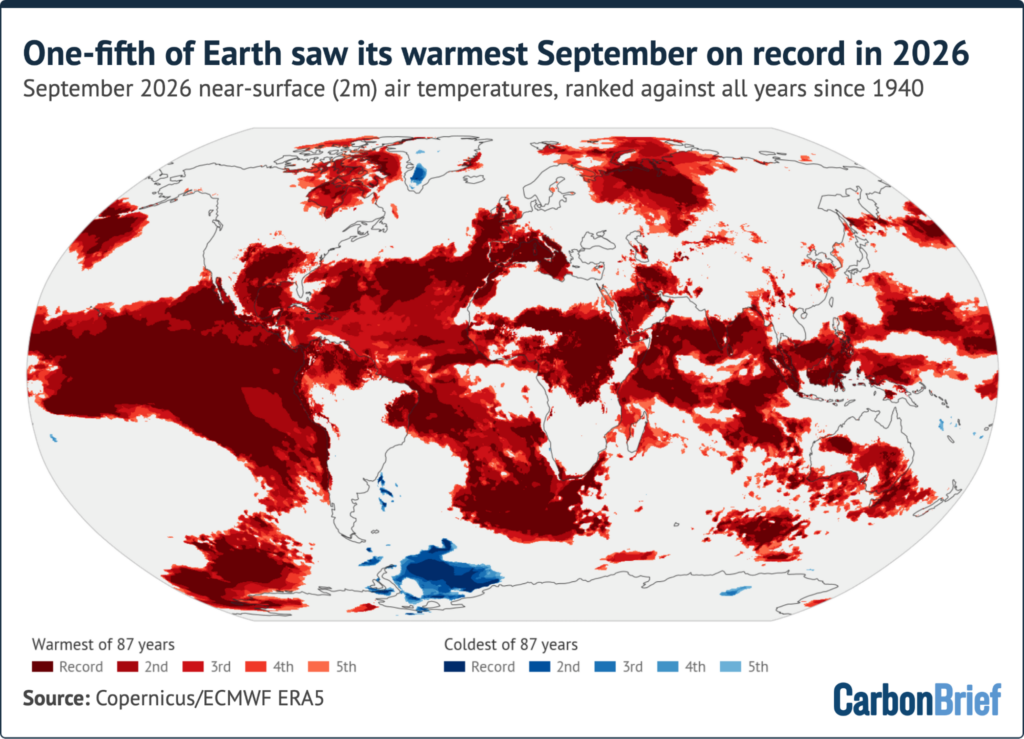
Overall, 55 countries set national records for September average temperatures, including Chile, Colombia, Italy, Kenya, Nigeria, the Philippines, Portugal, Spain, the United Arab Emirates, US and Venezuela.
Europe had an exceptional summer, with the western part of the continent experiencing its hottest summer on record.
Copernicus reported that western Europe’s summer averaged 21.7C – 2.5C above the 1991-2020 average – beating the previous record set in 2003. A record 52% of the continent was exposed to “very strong” heat stress by the end of the season.
Europe as a whole had its third-warmest summer, behind 2024 and 2022.
France had its warmest July on record, at 3.8C above the 1991-2020 average. Switzerland had its hottest summer since records began, averaging 17.2C.
The heat persisted into the autumn in south-west Europe. Spain had its warmest September on record, at 3.4C above the 1991-2020 average. This beat the previous record set in 1987 by a remarkable 0.7C.
Rivers across Europe saw their lowest summer flows since the European Flood Awareness System’s records began in 1992. By early September, the area burned across the EU was almost twice the 2006-25 average for the time of year, according to Copernicus, extending what had already been a severe fire season.
Elsewhere, the contiguous US had its hottest summer on record and its warmest September, with around 59% of the country in drought conditions.