- Clean-tech exports
- Solar exports are the biggest enabler
- Global South dominates avoided emissions
- Clean-tech exports span the globe
- Overseas clean energy projects double over three years
- China’s exports enable market growth
- Electrification export implications
- About the data
China’s exports in 2026 of clean-energy technologies, such as solar panels, batteries and electric vehicles, are on track to cut emissions beyond its borders by 2%, reveals new analysis.
This guest post is by:
Lauri Myllyvirta, lead analyst at the Centre for Research on Energy and Clean Air and senior fellow at Asia Society Policy Institute
The impact of these Chinese exports on carbon dioxide (CO2) emissions around the world grew by 26% year-on-year in the first three quarters of 2026, having already risen by 36% in 2025.
The new analysis for Carbon Brief is based on detailed data for clean-tech product exports, the electricity system in destination countries and emissions during manufacturing in China.
If the latest trends continue for the rest of the year, then Chinese clean-tech exports in 2026 alone will avoid around 450m tonnes of CO2 (MtCO2) – roughly equivalent to Brazil’s annual emissions.
Other key findings from the analysis include:
- Electric car and heavy vehicle shipments grew by 61% year-on-year in the first three quarters of 2026, wind-turbines by 45%, batteries 39%, solar 22% and electric two-wheelers by 21%.
- Over the lifetime of the equipment, exports in 2026 are on track to avoid 8,400MtCO2, equivalent to the annual emissions of the US and India combined.
- This lifetime avoided emissions total for exports in 2026 is up by a quarter from 6,800MtCO2 in 2025 and up by two-thirds from 5,000MtCO2 in 2024.
- Wind- and solar-equipment exports from China in 2026 will generate as much electricity each year as roughly 100 coal-fired power plants.
- While the majority of clean-tech exports by value went to the global north in the first three quarters of 2026, some 76% of lifetime avoided emissions were in the global south.
- This includes 52% of lifetime avoided emissions being in south and south-east Asia, reflecting solar shipments from China being installed onto high-carbon power grids.
- Chinese-owned clean-energy projects built in other countries doubled from 2022-25, but the amount of CO2 avoided remains small compared to equipment exports.
The analysis shows that most of China’s clean-energy exports have been built on new or expanded markets, enabling other producers to maintain their own sales volumes.
In addition, clean-energy sales within China are larger than exports for most technologies, but a domestic solar slowdown could exacerbate trade tensions, if it continues.
Clean-tech exports
China has become the pre-eminent producer of clean-energy technologies, from solar panels and wind turbines through to batteries and electric vehicles.
The majority of China’s clean-tech production is destined for the domestic market. But it has also become a major exporter – and these exports are avoiding significant amounts of CO2.
Previous analysis for Carbon Brief showed that these clean-energy exports in 2024 would cut emissions in countries outside China by around 1%.
The latest analysis shows that China’s clean-tech exports in 2026 are on track to avoid around 450MtCO2, as shown in the figure below, which is nearly 2% of global emissions outside China. It is also roughly equivalent to Brazil’s annual CO2 emissions from fossil fuels.
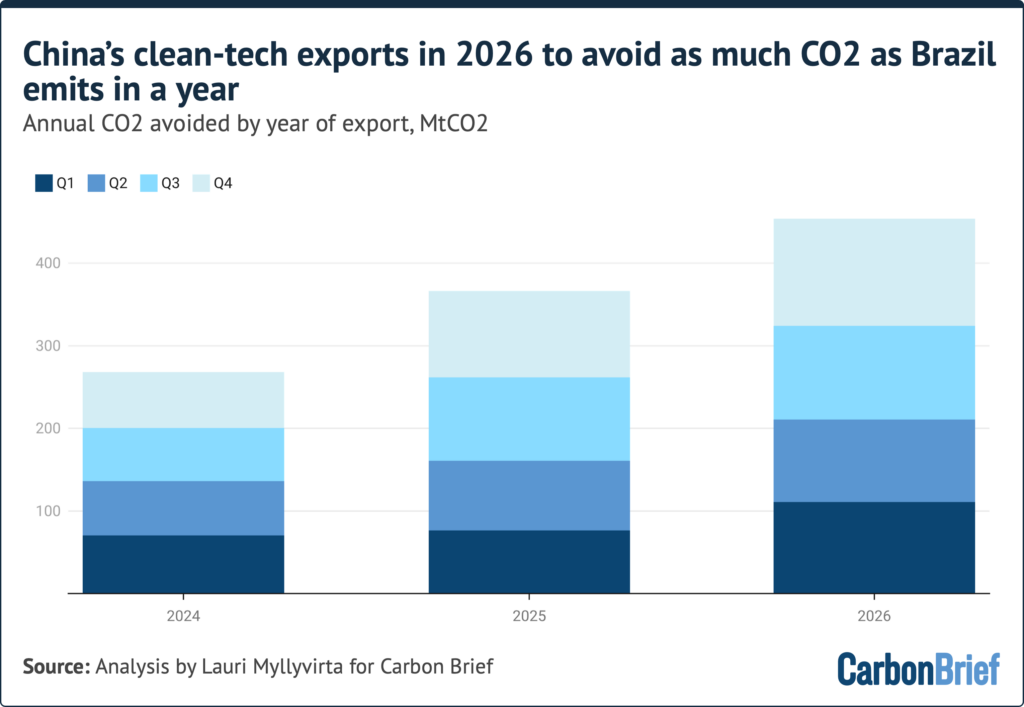 The estimate for the final quarter of 2026 is projected from the year-on-year growth rate in the first three quarters. CO2 emissions outside China from Energy Institute data. For further details see: About the data.
The analysis accounts for the impact of the clean-tech exports in the destination country, as well as the emissions due to manufacturing the products in China.
Looking at the full-year data for 2025, manufacturing clean-energy equipment resulted in emissions of around 170MtCO2 within China, while avoiding 370MtCO2 in other countries. This implies that, in aggregate, it takes six months for the exported goods to pay back the CO2 from manufacturing.
Solar exports are the biggest enabler
China’s solar-equipment exports continue to be the biggest enabler of decarbonisation in other countries, according to the analysis.
In the full-year data for 2025, China exported finished solar panels and intermediate products that correspond to a total generating capacity of 436 gigawatts (GW) once assembled and installed.
(Note that this is measured in gigawatts DC, which reflects the capacity of the panels, whereas capacity measured in AC refers to the size of the wire that connects them to the grid.)
In addition, China exported 8GW of wind turbines. Together with the solar equipment, this will generate approximately 720 terawatt-hours (TWh) of electricity per year, based on the average output per unit of capacity for solar and wind in each destination country.
For 2026, China’s exports of wind and solar equipment are on track to generate approximately 800TWh of electricity, equivalent to the generation from around 100 coal-fired power plants.
Over their lifetimes, based on the power sources expected to be displaced in each destination country, the solar exports in 2025 will avoid an estimated 6,400MtCO2.
(For more details on the basis for these calculations, see: About the data.)
Solar is therefore the largest source of lifetime avoided CO2 emissions by far, with wind-turbine exports in second place displacing just 180MtCO2, as shown in the figure below.
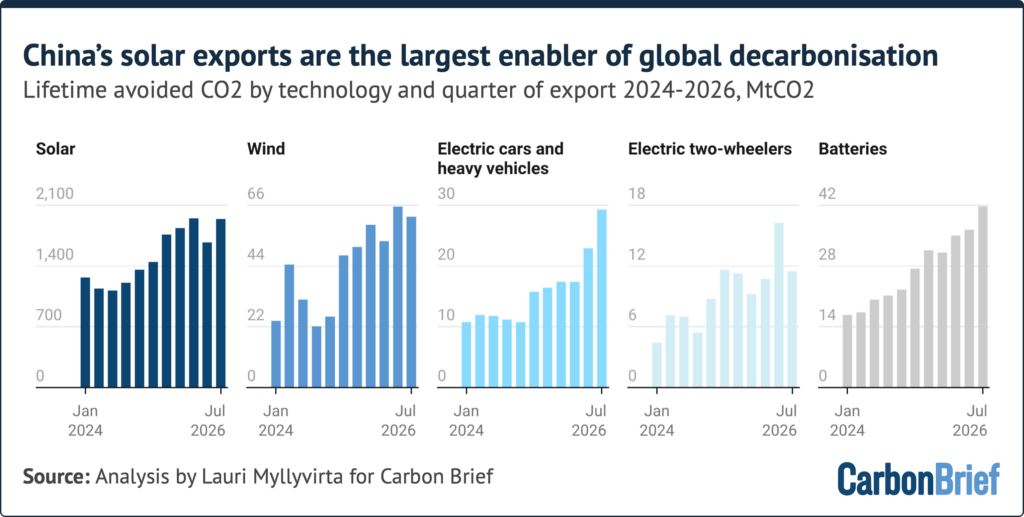 Note the variable y-axes. Avoided emissions are net of manufacturing and assume lifetimes of 20 years for solar and wind, 10 years for cars and batteries or 5 years for two-wheelers. For further details see: About the data.
The 39m electric vehicles exported from China in 2025 included 36m two-wheelers, 2.2m battery electric cars, 160,000 plug-in hybrid cars, 15,000 buses and 30,000 trucks.
In addition, China exported batteries with a capacity of 305 gigawatt-hours (GWh) in 2025, enough to power another 5m battery electric cars once installed, based on typical battery sizes.
Based on typical driving distances and fuel consumption for corresponding fuel-burning vehicles, as well as the CO2 intensity of the electricity grid in destination countries, the EVs and batteries exported in 2025 will avoid an estimated 170MtCO2 over their lifetimes.
Given the sheer number of electric two-wheelers, the amount of oil and resulting CO2 they displace is a key uncertainty. Real–world e-bike studies support an assumption that roughly half of e-bike travel displaces the use of motor vehicles, either cars or motorbikes depending on location.
This suggests that, when taking into account the electricity grid in importing nations, China’s electric two-wheeler exports in 2025 will avoid an estimated 40MtCO2 over their lifetimes.
Global South dominates avoided emissions
In 2025, some 73% of the lifetime emissions avoided by China’s clean-tech exports were in global-south countries, which also accounted for 87% of the growth year-on-year.
In the first three quarters of 2026, global-south countries were responsible for almost all of the increase in avoided emissions compared with a year earlier, as shown in the figure below.
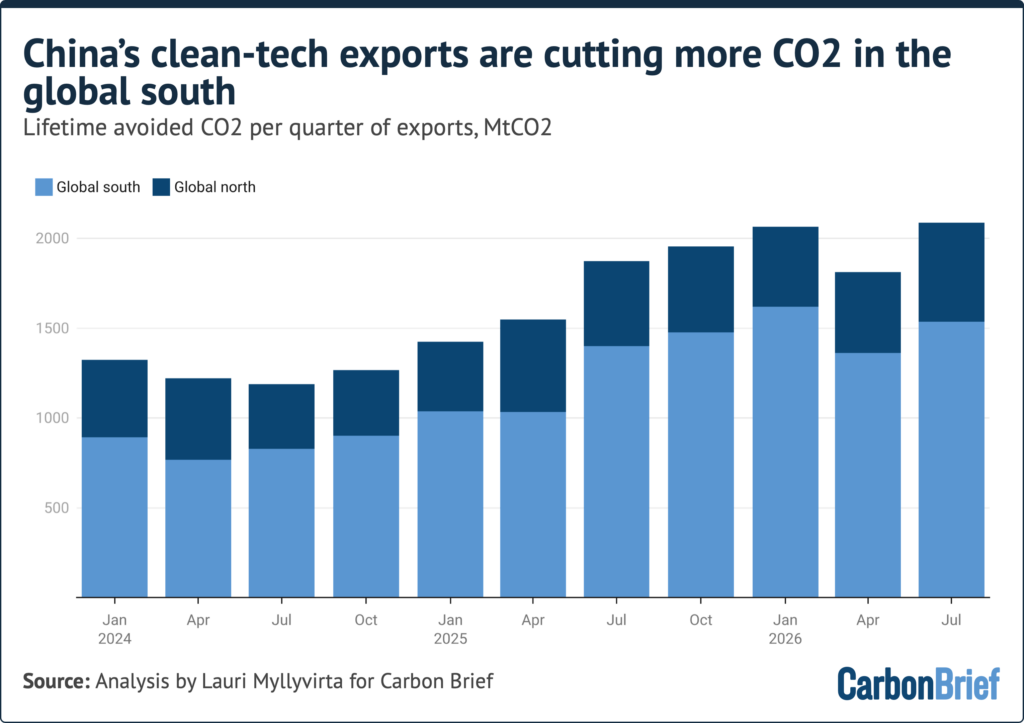 Final destinations for solar exports account for re-export, including post-tariff re-routing to the US via assembly or transit in third countries. For further details see: About the data.
The high share of the global south in avoided emissions reflects large export volumes and power grids that are more carbon-intensive on average, as well as better average solar conditions that result in larger avoided emissions for each gigawatt of solar exported.
Clean-tech exports span the globe
On the regional level, South Asia has the largest avoided emissions due to imports of Chinese clean-tech, with strong year-on-year growth both in 2025 and the first three quarters of 2026.
Other top regional destinations in 2026 to date, in terms of lifetime avoided emissions, include south-east Asia, North America, Europe and the Middle East.
However, the exports span the globe, as shown in the map below, avoiding billions of tonnes of CO2 across every continent and in nearly every country of the world.
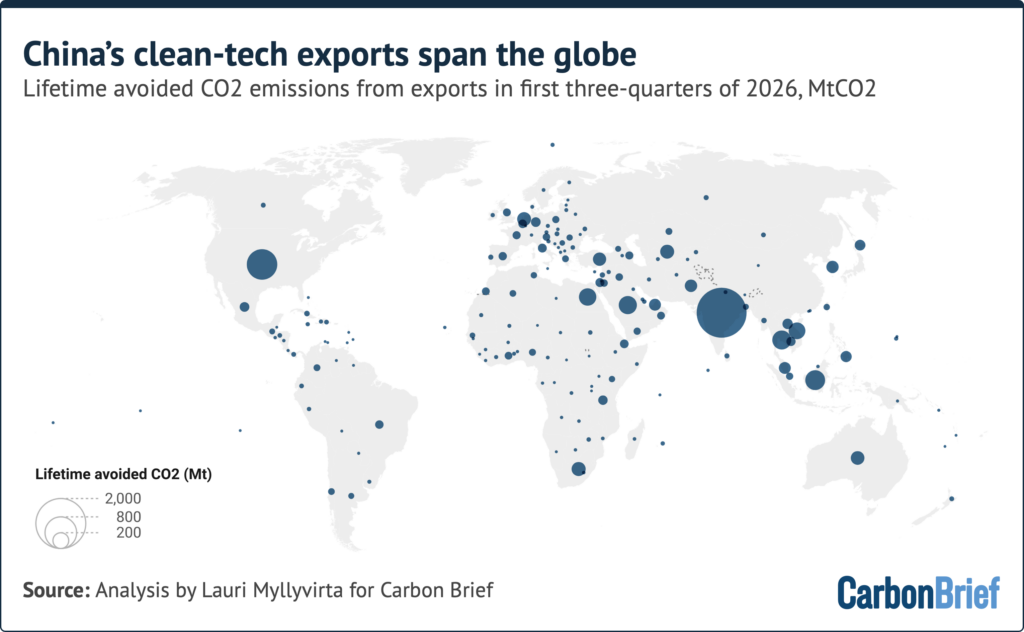
Among countries, the US has the second-largest avoided emissions after India. It registered a further increase of 12% in 2026, despite increased tariffs, and exceeds the EU as a bloc. The US is followed by Thailand, Saudi Arabia, South Africa and Australia.
The EU imports more of every clean energy technology than the US, but the US has higher avoided emissions. This is because average US solar output per unit of capacity is higher – as is the average CO2 intensity of power generation. As a result, every gigawatt of solar installed in the US results in three-times more avoided CO2 emissions than in the EU.
The resilience of Chinese clean-tech exports to the US indicates strong demand for the technology, despite the Trump administration’s steps to slow down deployment and discourage imports.
The data suggests that reducing reliance on technology supply from China – a policy aim of recent administrations from both parties – is likely to require scaling up of domestic and third-country manufacturing of the key technologies, in order to meet that resilient demand.
The largest change in the national rankings for avoided emissions from clean-tech exports in 2026, compared with the previous year, has been a fall in exports to the Gulf countries affected by the war in the region.
For electric cars and heavy vehicles, western Europe was the largest destination in the first three quarters of 2026, followed by Latin America and south-east Asia, both of which more than doubled, reflecting the impact of the oil crisis. Exports to the EU gained 39%.
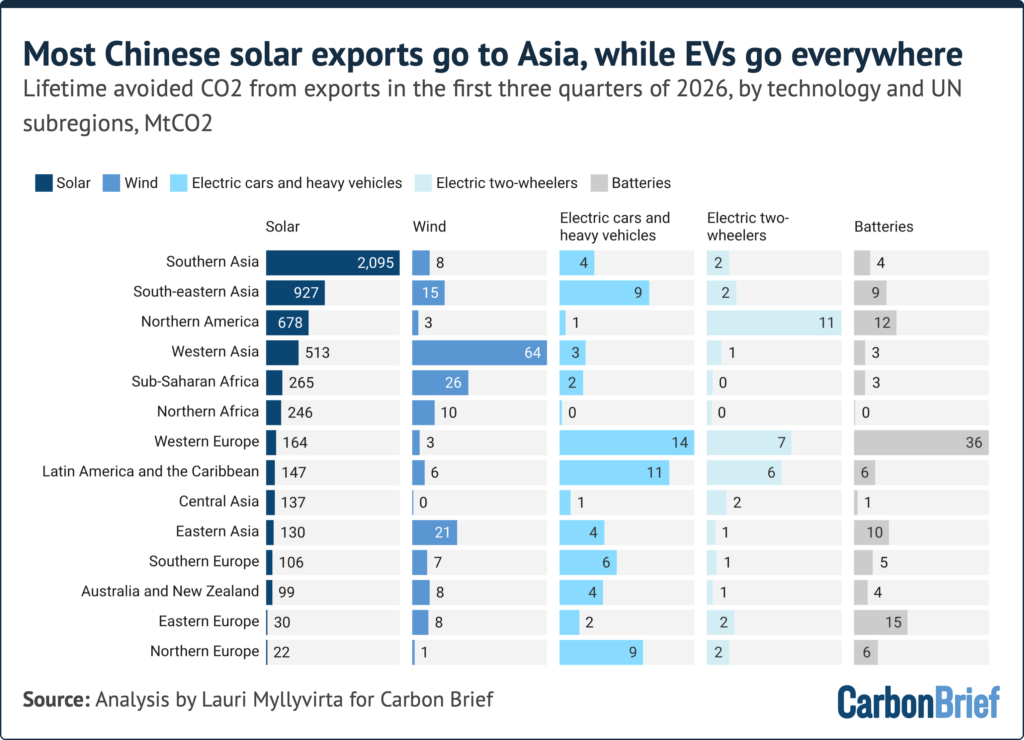 Regional aggregation according to UN subregions, including “western Asia”, which encompasses Turkey, the Caucasus and the Middle East Final. Destinations for solar exports account for re-export, including post-tariff re-routing to the US via assembly or transit in third countries. For further details see: About the data.
When including batteries and electric two-wheelers, North America and Europe are the largest destinations for avoided emissions due to EV-related exports, followed by Latin America and south-east Asia.
Exports of Chinese solar equipment to the US rose 13% year-on-year in the first three quarters of 2026, once re-routing through different channels is considered. This is a reversal of the dip early in the year, due to a sharp increase in tariffs in June 2025. Exports of EVs and batteries to the US also increased slightly, by 3% in the first three quarters of 2026.
Overseas clean energy projects double over three years
In addition to its clean-tech exports, China is also increasingly becoming directly involved in the development of overseas clean-energy projects.
This can be traced back to the 2021 pledge by Chinese president Xi Jinping, in which he said:
“China will step up support for other developing countries in developing green and low-carbon energy, and will not build new coal-fired power projects abroad.”
As of July 2026, some 69GW of China-linked renewable energy projects were in operation overseas. An additional 100GW are being built, with 280GW in planning but not yet under construction. This renewable energy capacity is supported by 3.5GW of China-linked energy storage projects in operation, with a further 21.4GW of storage in the pipeline.
China has also financed and built six operating nuclear reactors overseas, with a total capacity of 3.3GW. These are all located in Pakistan and, in 2023, they had a total generation of 26TWh. China began construction on the 1.2GW Chashma-5 reactor in 2024, also in Pakistan, with the plant expected to be operational around 2030.